
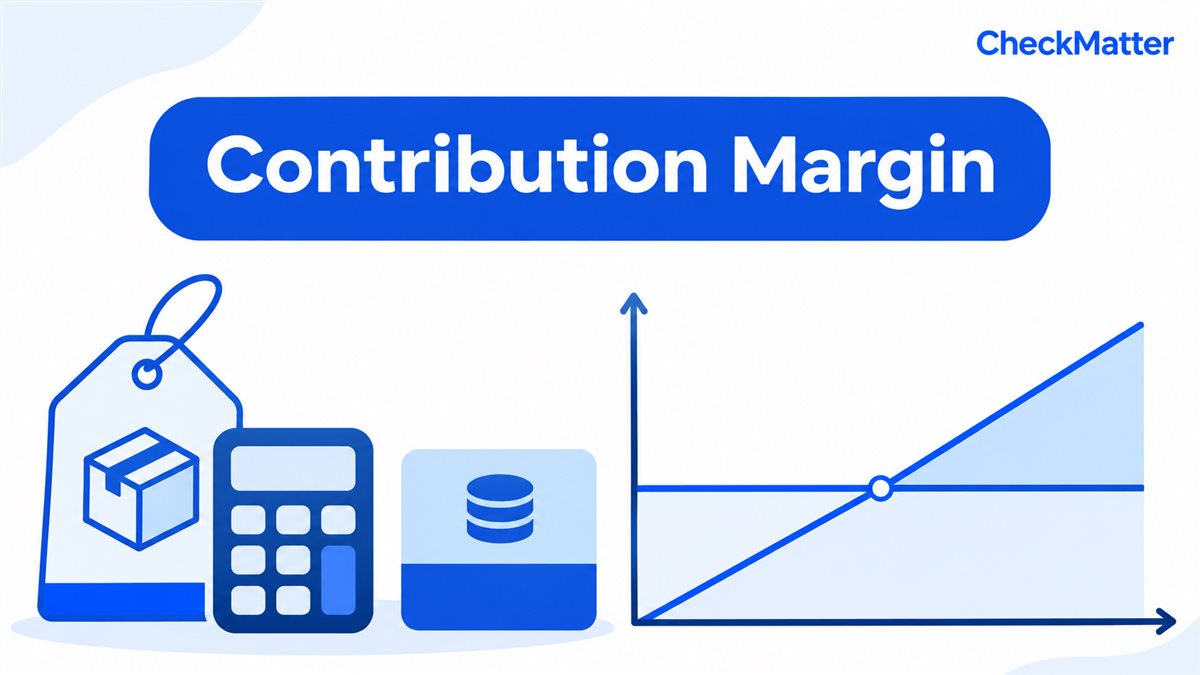
Contribution margin is sales revenue minus variable costs. It shows how much each sale contributes toward fixed costs and modelled operating profit. In the example below, ₹200 contribution per sale covers ₹120,000 of fixed costs at 600 units.
Core formulas
Contribution per unit = selling price − variable cost per unit
Contribution margin ratio = contribution per unit ÷ selling price
Break-even units = fixed costs ÷ contribution per unit
Worked example
A business has monthly fixed costs of ₹120,000. A product sells for ₹500 and has variable costs of ₹300. Contribution per unit is ₹200 and the contribution margin ratio is 40%. Break-even volume is ₹120,000 ÷ ₹200 = 600 units. The 601st unit begins contributing to operating profit, assuming the inputs stay unchanged.
These are illustrative monthly inputs for one product, not a market-price quote or a demand forecast. Keep selling price and unit variable cost constant, and use fixed costs from the same month. The worksheet excludes any tax, financing or other cost not entered.
| Units sold | Total contribution | Operating profit |
|---|---|---|
| 599 | ₹119,800 | −₹200 |
| 600 | ₹120,000 | ₹0 |
| 601 | ₹120,200 | ₹200 |
For each row, revenue is units × ₹500, variable costs are units × ₹300, and operating profit is total contribution minus ₹120,000. The break-even point is the middle row: contribution exactly covers fixed costs.
What counts as variable cost?
Include costs that change with each sale: direct materials, per-order packaging, sales commission, transaction charges, and shipping paid per order. Rent, core salaries, and software subscriptions are usually fixed within a defined range, although real businesses can have mixed costs.
Use the result for decisions
- Compare products by contribution per constrained resource.
- Test how a discount changes break-even volume.
- Estimate the sales volume needed for a target profit.
- Recalculate when input prices or marketplace fees change.
The Percentage Calculator can check the contribution ratio, while the Discount Calculator helps model promotional prices.
Limitations
Break-even analysis assumes price and cost remain stable within the tested volume. Capacity limits, tiered shipping, wastage, tax, refunds, and inventory financing may change the real answer. Use a conservative range instead of treating one number as a guarantee.
With positive fixed costs, a selling price at or below unit variable cost gives no finite break-even quantity in this model. Revisit price or costs rather than dividing by zero or interpreting a negative result as a usable sales target. Contribution margin also differs from the cost-based percentages in our profit margin versus markup guide.
Frequently asked questions
Is contribution margin the same as net profit?
No. Contribution margin is calculated before fixed costs. Net profit is what remains after both variable and fixed expenses.
Should break-even units be rounded?
Round a fractional result upward to the next whole unit because a partial unit usually cannot be sold. An exact whole-number result stays unchanged: 600 units means 600, not 601.
Can a service business use this?
Yes. Replace units with billable projects, appointments, or hours and identify the variable cost for each.
Use contribution margin for product-mix decisions
When two products use the same limited machine time, shelf space or labour, the product with the higher contribution per constrained unit may be more valuable even if its contribution per sale is lower. Divide contribution by the scarce resource—for example, contribution per production hour.
Do not classify every cost permanently as fixed or variable. A salary may be fixed within the current capacity but become step-fixed when another employee is needed. Delivery may be variable per parcel but fall at a volume tier. Document the relevant volume range and rerun the calculation when the business crosses it.
Sources and verification
For the accounting method, see OpenStax on contribution margin and its ratio and break-even calculations and assumptions. Inputs here are hypothetical; the result is an educational operating model, not a guarantee of sales or accounting advice.
Examples, calculator and sources checked on 5 November 2026. No independent professional review is claimed. See our editorial policy.